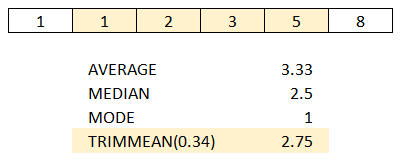
There are multiple ways of averaging values in DAX. Some of the most popular ways are mean (AVERAGE), median (MEDIAN) and mode (no built-in function; see DAX Patterns for an example). Yet another is TRIMMEAN, which exists in Excel. There is no corresponding function in DAX, and this blog post shows how you can replicate the function in DAX.
Miguel Escobar, a Microsoft MVP and a fellow Power BI enthusiast, pointed me to a post on his Spanish Power BI forum, where señor OD_GarcíaDeLaCruz requested advice on how we can imitate the TRIMMEAN function from Excel in DAX.
If you are not familiar with the function, I strongly advise you to read the documentation. In short, the function calculates the average while excluding a user-specified percentage of values from tails.
Existing solutions
The first thing I checked was DAX Patterns, which is usually a great source of ready-made solutions like this. Unfortunately, TRIMMEAN was not there, so I did some googling and realized that this problem has not been fully solved yet, as far as I could see.
Greg Baldini’s solution, for example, relies on your knowing the values you need to exclude in advance, which can be problematic in case you want your formula to work with duplicate values. Imke Feldmann, another Microsoft MVP, also proposed a solution that works in many cases except for those where there are duplicate values on the edges. This is because in DAX, there is no concept of row number that a user can access, so this problem requires a different approach.
My pattern
To use the following pattern, you need to replace the
- Green bit with the percent value between 0 and 1
- Yellow bits with your column reference
- Blue bit with the table of the column
TrimMean =
VAR TrimPercent = [Percent Value]
VAR Counts =
    SELECTCOLUMNS (
        VALUES ( 'Table'[Column] ),
        "Data Point", 'Table'[Column],
        "Count", CALCULATE ( COUNTROWS ( 'Table' ) )
    )
VAR NumberOfDataPoints =
    SUMX ( Counts, [Count] )
VAR StartAt =
    INT ( NumberOfDataPoints * TrimPercent / 2 )
VAR FinishAt = NumberOfDataPoints - StartAt
VAR RunningCounts =
    ADDCOLUMNS (
        Counts,
        "RunningCount",
        VAR ThisDataPoint = [Data Point]
        RETURN
            SUMX ( FILTER ( Counts, [Data Point] <= ThisDataPoint ), [Count] )
    )
VAR TrimmedCounts =
    ADDCOLUMNS (
        RunningCounts,
        "Trimmed Count",
        VAR ThisDataPoint = [Data Point]
        VAR MinRunningCount =
            MINX (
                FILTER ( RunningCounts, [RunningCount] >= StartAt ),
                [RunningCount]
            )
        VAR MaxRunningCount =
            MAXX (
                FILTER ( RunningCounts, [RunningCount] <= FinishAt ),
                [RunningCount]
            )
        VAR TrimmedTop =
            MAX ( [RunningCount] - StartAt, 0 )
        VAR TrimmedBottom =
            MAX ( [Count] - MAX ( [RunningCount] - FinishAt, 0 ), 0 )
        RETURN
            SWITCH (
                TRUE,
                [RunningCount] <= MinRunningCount, TrimmedTop,
                [RunningCount] > MaxRunningCount, TrimmedBottom,
                [Count]
            )
    )
VAR Numerator =
    SUMX ( TrimmedCounts, [Data Point] * [Trimmed Count] )
VAR Denominator =
    SUMX ( TrimmedCounts, [Trimmed Count] )
VAR TrimmedMean =
    DIVIDE ( Numerator, Denominator )
VAR Result =
    IF (
        OR ( TrimPercent < 0, TrimPercent >= 1 ),
        ERROR ( "Trim percent must be greater or equal to 0 and less than 1" ),
        TrimmedMean
    )
RETURN
    Result
The formula is quite complicated but hopefully easy to use. The formula above only works on physical columns. If you want to use TRIMMEANX-like logic, your Counts variable may look like this:
VAR Counts =
    GROUPBY (
        SELECTCOLUMNS (
            Your category table expression,
            "Data Point", Expression to average
        ),
        [Data Point],
        "Count", SUMX ( CURRENTGROUP(), 1 )
    )
On large tables, the performance may not be that great. If you can write it in a more efficient way, let me know!