TRIMMEAN in DAX

TRIMMEAN in DAX

There are multiple ways of averaging values in DAX. Some of the most popular ways are mean (AVERAGE), median (MEDIAN) and mode (no built-in function; see DAX Patterns for an example). Yet another is TRIMMEAN, which exists in Excel. There is no corresponding function in DAX, and this blog post shows how you can replicate the function in DAX.

Miguel Escobar, a Microsoft MVP and a fellow Power BI enthusiast, pointed me to a post on his Spanish Power BI forum, where señor OD_GarcíaDeLaCruz requested advice on how we can imitate the TRIMMEAN function from Excel in DAX.

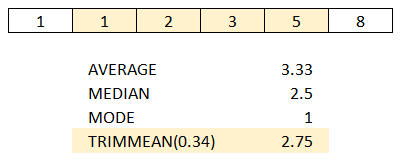
If you are not familiar with the function, I strongly advise you to read the documentation. In short, the function calculates the average while excluding a user-specified percentage of values from tails.

Existing solutions

The first thing I checked was DAX Patterns, which is usually a great source of ready-made solutions like this. Unfortunately, TRIMMEAN was not there, so I did some googling and realized that this problem has not been fully solved yet, as far as I could see.

Greg Baldini’s solution, for example, relies on your knowing the values you need to exclude in advance, which can be problematic in case you want your formula to work with duplicate values. Imke Feldmann, another Microsoft MVP, also proposed a solution that works in many cases except for those where there are duplicate values on the edges. This is because in DAX, there is no concept of row number that a user can access, so this problem requires a different approach.

My pattern

To use the following pattern, you need to replace the

  1. Green bit with the percent value between 0 and 1
  2. Yellow bits with your column reference
  3. Blue bit with the table of the column
TrimMean = 
VAR TrimPercent = [Percent Value]
VAR Counts =
    SELECTCOLUMNS (
        VALUES ( 'Table'[Column] ),
        "Data Point", 'Table'[Column],
        "Count", CALCULATE ( COUNTROWS ( 'Table' ) )
    )
VAR NumberOfDataPoints =
    SUMX ( Counts, [Count] )
VAR StartAt =
    INT ( NumberOfDataPoints * TrimPercent / 2 )
VAR FinishAt = NumberOfDataPoints - StartAt
VAR RunningCounts =
    ADDCOLUMNS (
        Counts,
        "RunningCount",
        VAR ThisDataPoint = [Data Point]
        RETURN
            SUMX ( FILTER ( Counts, [Data Point] <= ThisDataPoint ), [Count] )
    )
VAR TrimmedCounts =
    ADDCOLUMNS (
        RunningCounts,
        "Trimmed Count",
        VAR ThisDataPoint = [Data Point]
        VAR MinRunningCount =
            MINX (
                FILTER ( RunningCounts, [RunningCount] >= StartAt ),
                [RunningCount]
            )
        VAR MaxRunningCount =
            MAXX (
                FILTER ( RunningCounts, [RunningCount] <= FinishAt ),
                [RunningCount]
            )
        VAR TrimmedTop =
            MAX ( [RunningCount] - StartAt, 0 )
        VAR TrimmedBottom =
            MAX ( [Count] - MAX ( [RunningCount] - FinishAt, 0 ), 0 )
        RETURN
            SWITCH (
                TRUE,
                [RunningCount] <= MinRunningCount, TrimmedTop,
                [RunningCount] > MaxRunningCount, TrimmedBottom,
                [Count]
            )
    )
VAR Numerator =
    SUMX ( TrimmedCounts, [Data Point] * [Trimmed Count] )
VAR Denominator =
    SUMX ( TrimmedCounts, [Trimmed Count] )
VAR TrimmedMean =
    DIVIDE ( Numerator, Denominator )
VAR Result =
    IF (
        OR ( TrimPercent < 0, TrimPercent >= 1 ),
        ERROR ( "Trim percent must be greater or equal to 0 and less than 1" ),
        TrimmedMean
    )
RETURN
    Result

The formula is quite complicated but hopefully easy to use. The formula above only works on physical columns. If you want to use TRIMMEANX-like logic, your Counts variable may look like this:

VAR Counts =
    GROUPBY (
        SELECTCOLUMNS (
            Your category table expression,
            "Data Point", Expression to average
        ),
        [Data Point],
        "Count", SUMX ( CURRENTGROUP(), 1 )
    )

On large tables, the performance may not be that great. If you can write it in a more efficient way, let me know!

  • Jes Hansen

    Hi Daniil,

    the trimmed mean issue you – very elegantly – have solved has a certain similarity to a task I undertook a while ago. I have tried – to the best of my memory – to translate my algorithm into processing a trimmed mean instead of the particular task I was solving.

    Your version is easily faster than mine when only a few distinct values ( up to 6000-7000 perhaps ) of the averaged column exist; however, if many distinct values exist my version will probably be faster, especially when at the same time many rows are processed.

    You and your readers can try it out using one of the sample files from Marco and Albertos new Definitive Guide to DAX book. You’ll find several samples with a sales table containing 100,000 rows. If you randomize – say the unit price column – creating a calculated column like this:

    = Sales[Unit Price] + ROUND(RANDBETWEEN(-9999;9999)/1000;2)

    You should be able to see the difference.

    Here is the measure:

    TrimMean =
    VAR TrimPercent = 0.05
    RETURN
    AVERAGEX (
    VAR numberofrows =
    COUNTROWS ( Sales )
    // number of rows in either tail
    VAR numberoftrimmedrowsineithertail =
    TRUNC ( numberofrows * TrimPercent / 2 )
    RETURN
    // removes trimmed tail values by using two reversed TOPNs
    // REMEMBER the inner TOPN is executed first
    // --
    // the outer TOPN removes the TRUNC ( numberofrows * TrimPercent / 2 ) smallest values
    TOPN (
    numberofrows - ( 2 * numberoftrimmedrowsineithertail ),
    // the inner TOPN removes the TRUNC ( numberofrows * TrimPercent / 2 ) largest values
    TOPN (
    numberofrows - numberoftrimmedrowsineithertail,
    SELECTCOLUMNS (
    sales,
    "columntoaverage", Sales[unit price],
    "randomtiebreak", RAND ()
    ),
    [columntoaverage], ASC,
    // tie breaker
    [randomtiebreak], ASC
    ),
    // reverse sorting - removes smallest values
    [columntoaverage], DESC,
    // tie breaker
    [randomtiebreak], DESC
    ),
    // column to average
    [columntoaverage]
    )

    My version is (almost ) linear of nature, so it doesn’t matter how many distinct values you have but rather the number of rows it scans. The sorts will take up some RAM when the measure is executing though. If I recall right my version isn’t too sensitive to dicing. So if you add year and month etc. columns to a pivot table the measure won’t increase in execution time too much. Your version might be more sensitive in that regard.

    It’s always difficult to compare two versions because many parameters have their say.

    Best regards Jes.

    • Jes, adding a random number to distinguish between duplicates is a very smart technique — thanks for sharing!

      I’m trying to test your measure on Sales[Net Price] from Contoso from TDGTD2 (Chapter 20), which has about 12.5 million rows and 2,469 distinct values, and it just won’t calculate (I cancel after waiting for a minute), while my version finishes in less than a second. Can you please confirm it works for you? Perhaps I’m doing something incorrectly?

      • Jes Hansen

        If I run my measure as a query using the Contoso DB from the book like this:

        Evaluate
        { my measure }

        and your measure the same way:

        My measure: 20,000 ms.
        Your measure: below 100 ms.

        So here there definitely is a HUGE difference in your measure’s favor. I’m afraid the two sorts I make use of take a toll here. This actually goes hand in hand with the tests I, tentatively, ran. When only a few distinct values exist your measure excels. A few distinct values translate into some thousands. Exactly where the split occurs can be difficult to say and other circumstances could have an influence as well.

        Originally my measure (not exactly the same measure, that I posted) was applied to a fact table of 8-9 million rows. I don’t remember how many distinct values existed. The task was a little bit different but I’ll see if I can get them to try out your measure and see if there is a difference.

        I ran the above test on my very old home PC with 8 GB of RAM. Exactly why your test took so long I’m not sure, however, if not enough RAM you’ll probably see some or a lot of paging which could explain it. TOPN can be memory hungry the same way that RANKX can be compute intensive.

        PS: If you want to test your measure with many distinct values you probably should not use a calculated column as the column you measure (I suggested this in my comment), instead you should create a column in the source data. That way the engine gets a possibility to compress the data better. A calculated column stands on the shoulders of the other columns and is probably not as well compressed as a source column.

        • Jes, my apologies — I left out a key detail: I was running our formulas over a range of TrimPercent values. I had them from 0.05 to 0.95 with a step of 0.05 (a What If parameter). So if evaluating just one cell of your formula takes 20 seconds, it makes perfect sense why it didn’t finish calculating for me when I evaluated for 19 TrimPercent values.

          Good takeaways here — thanks again for sharing!

    • Hi, Jes, can you please reach out to me on LinkedIn or via email (daniil at this domain) to discuss a potential project?

  • oscar garcia de la cruz

    I don.t know how to thanks your help!! I,ll check it as soon as possible and give you news.

    Thanks again!

  • Ismael Ayala

    Danii, many thanks for your sharing. It helped me a lot!

    Imagine that I would like to group by some dimesions, and do trimmean of a calculated column of this grouping. Would be possible to implement it in your well done code?
    I am on PowerPivot so a can not create a calculatedtable in the same way we do on PowerBI.

    Thanks in advance!

  • canufrank

    wonderful. thanks.