In August 2018, a new type of conditional formatting has been added to Power BI: by field value. In this blog post I’m explaining how it works.
This feature is already available in Power BI service and is coming to Power BI Desktop in the next release.
First of all, here are the two conditional formatting options that we’ve had before:
- Color scale
Based on the measure/summarized column numerical value - Rules
Similar to color scale, but with a specific color for each range of values
How is conditional formatting by field value different?
You can use color code values from the data model itself!
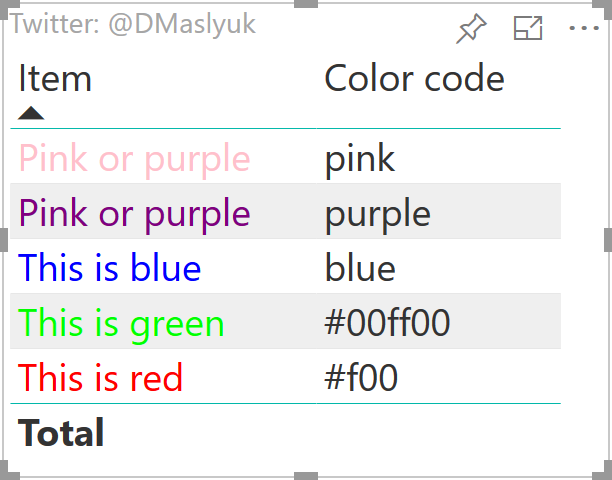
Here is a table we will use in our simplistic example:
| Item | Color code |
| This is red | #f00 |
| This is green | #00ff00 |
| This is blue | blue |
| Pink or purple | pink |
| Pink or purple | purple |
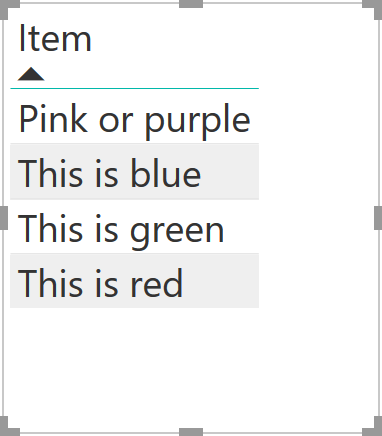
Once we publish this data model to Power BI service, we create a table visual with just the Item column:
Then we go to the conditional formatting dialog box (font color in our example) and select Format by Field value, choosing Color code as the field:
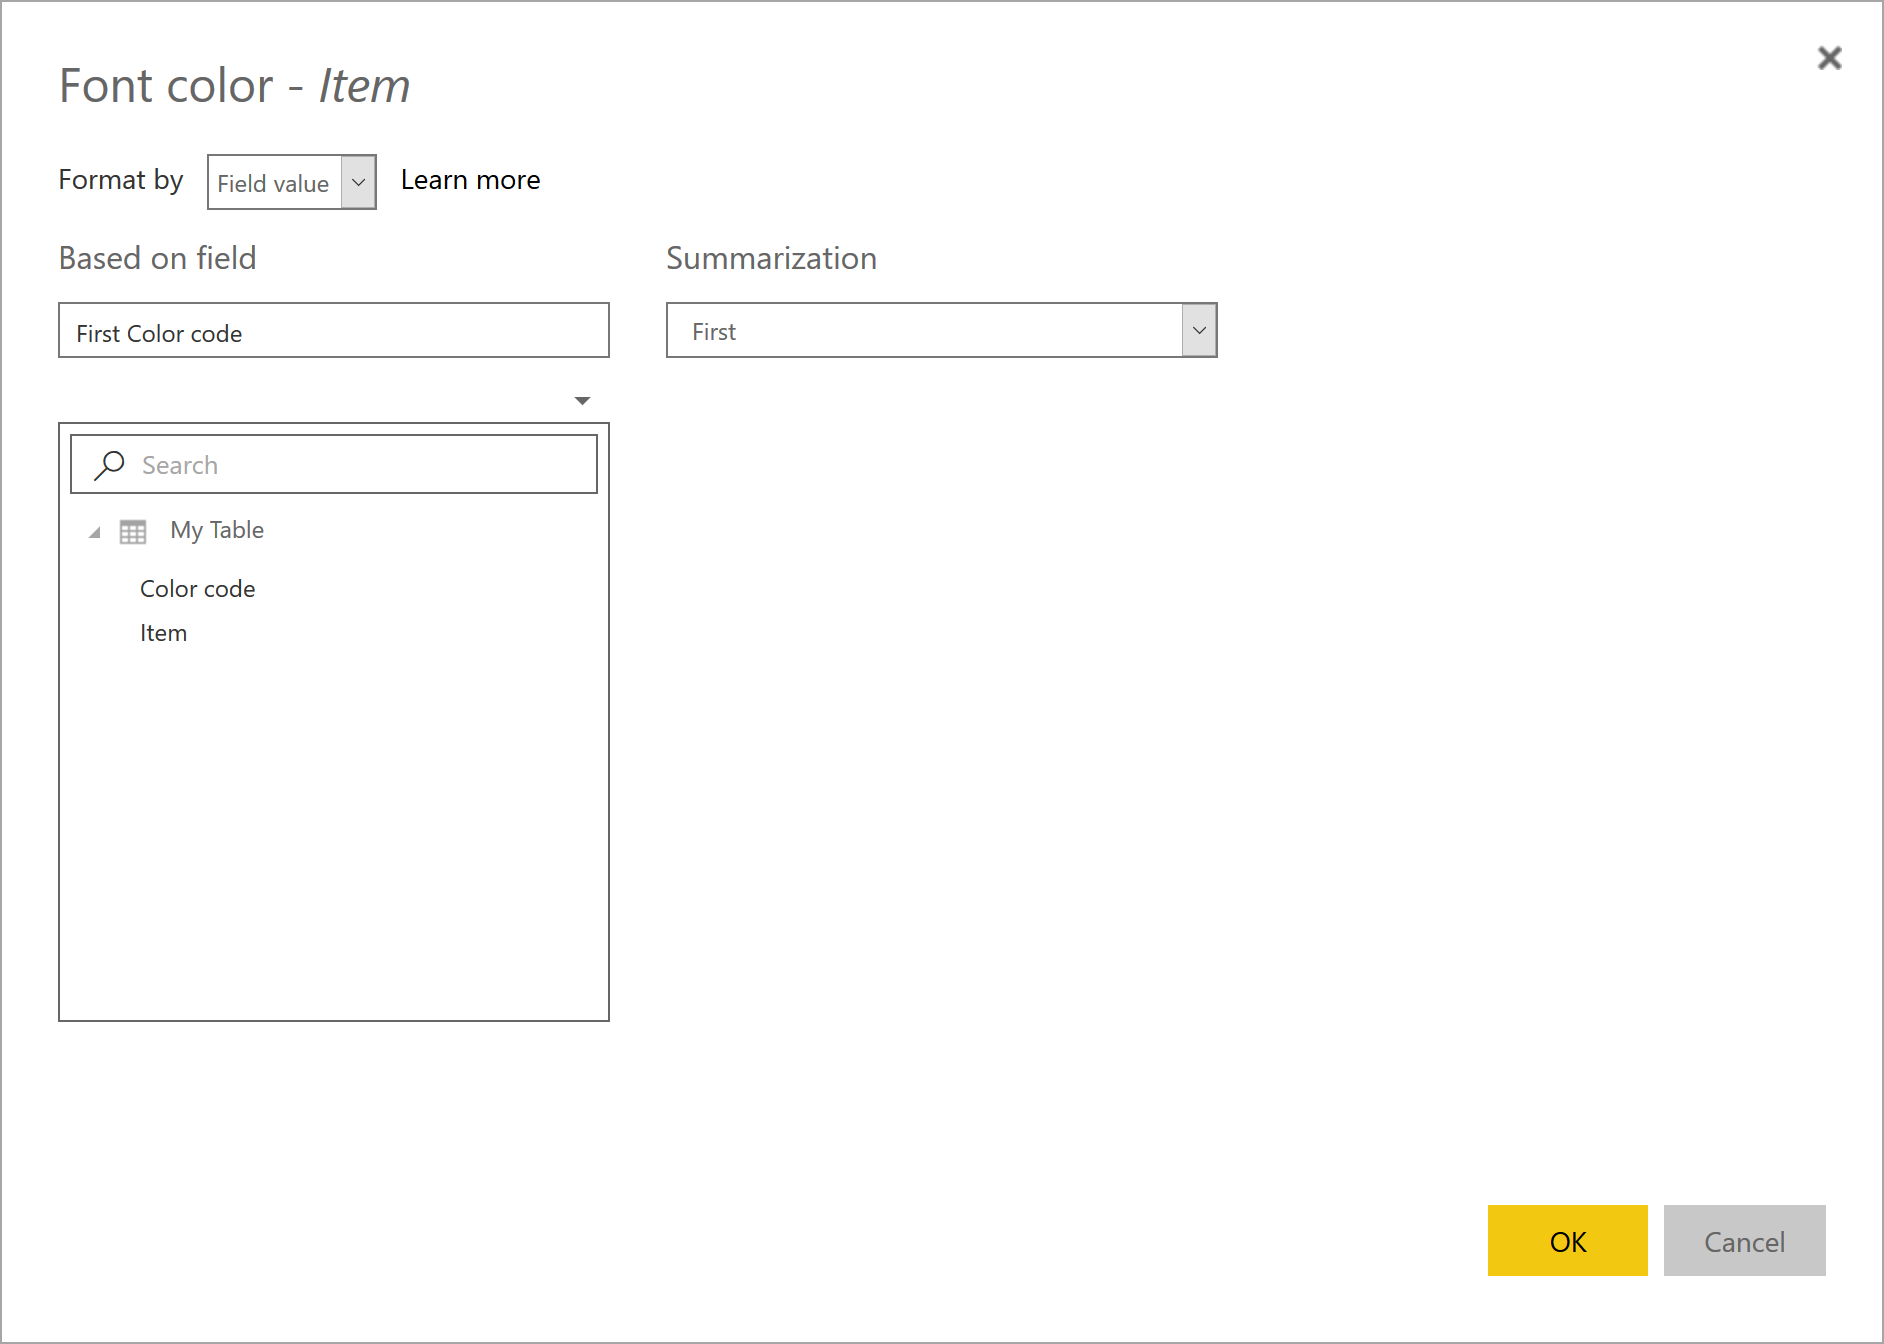
The summarization selection matters when there is more than one color for an item, like for Pink or purple in our example.
After we click OK, we see the following:
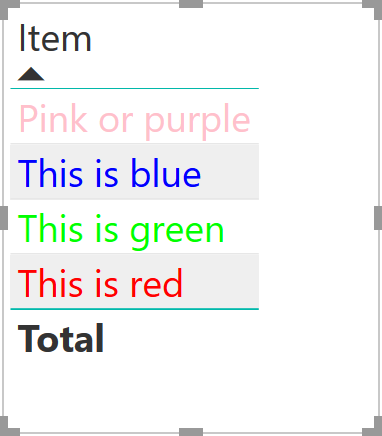
If we chose “Last” as summarization, the top item would be colored purple.
Note how you can choose the same three color code formats that CSS would accept. For example, the following three colors correspond to red:
- #f00
- #ff0000
- red
Happy coloring!