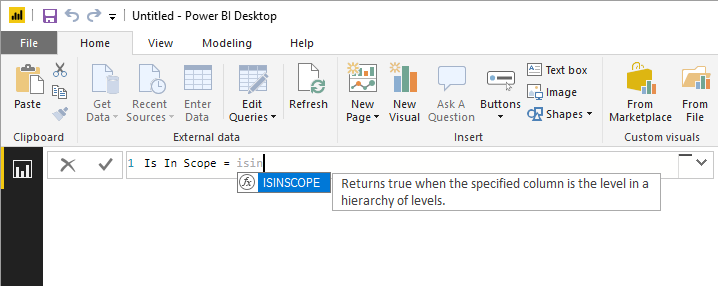
A new DAX function is coming in the November 2018 release of Power BI Desktop: ISINSCOPE. You can already try the new function in Power BI service and Azure Analysis Services. In this blog post, I am going to show where ISINSCOPE can be useful.
DAX Guide already includes the new function. Here’s its description from the website: “Returns TRUE if the column is in included in the filter context and it is a grouping column for the current row in the result set.”
While this may distantly remind you of ISFILTERED or ISCROSSFILTERED, there is an important difference that is easier to explain with an example.
Sample data model
Consider the following table called Cities:
| Country | City | Population |
| Australia | Sydney | 5,131,326 |
| Australia | Melbourne | 5,000,000 |
| New Zealand | Auckland | 1,695,900 |
| New Zealand | Wellington | 422,700 |
And the following measures:
City Is In Scope      = ISINSCOPE ( Cities[City] )
City Is Filtered      = ISFILTERED ( Cities[City] )
City Is Crossfiltered = ISCROSSFILTERED ( Cities[City] )
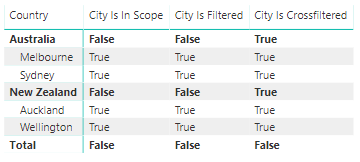
When we put the measures in a matrix together with Country and City, we will get the following result:

At this stage, ISINSCOPE behaves like ISFILTERED. ISFILTERED and ISCROSSFILTERED give you different results, as expected: when you filter Country, you crossfilter City too, because they are in the same table.
The difference between ISINSCOPE and ISFILTERED becomes clear as soon as we filter by City:

Note how ISINSCOPE returns FALSE both at the Country level and at the total level, while ISFILTERED and ISCROSSFILTERED always return TRUE. The latter two functions return TRUE because our slicer filters City.
ISINSCOPE is handy when you need to target the total level specifically. The usual way to check whether something is a total is by checking if a column is filtered. As you can see in the screenshot above, this does not always work.
Use cases
When can ISINSCOPE be useful? The classic SQLBI article, “Clever Hierarchy Handling in DAX“, immediately comes to mind. In case you haven’t read it, I encourage you to do so. In the article, one of the scenarios was showing the percentage of total with applied filters. At the time the article was written (over six years ago!), ISINSCOPE was not available, so Alberto duplicated columns and used them in a hierarchy, while slicing by the original columns. ISINSCOPE allows you to use a single set of columns.
I will use the following five measures to highlight the difference:
Total Population = SUM ( Cities[Population] )

Population AllSelected City =
CALCULATE (
    [Total Population],
    ALLSELECTED ( Cities[City] )
)

Population AllSelected Country =
CALCULATE (
    [Total Population],
    ALLSELECTED ( Cities[Country] )
)

Ratio to Parent ISFILTERED =
SWITCH (
    TRUE (),
    ISFILTERED ( Cities[City] ), DIVIDE (
        [Total Population],
        [Population AllSelected City]
    ),
    ISFILTERED ( Cities[Country] ), DIVIDE (
        [Total Population],
        [Population AllSelected Country]
    )
)

Ratio to Parent ISINSCOPE =
SWITCH (
    TRUE (),
    ISINSCOPE ( Cities[City] ), DIVIDE (
        [Total Population],
        [Population AllSelected City]
    ),
    ISINSCOPE ( Cities[Country] ), DIVIDE (
        [Total Population],
        [Population AllSelected Country]
    )
)
If we now use some of the above measures and filter by Auckland, Sydney and Wellington, we will get the following results:

Note how ISINSCOPE calculates the percentage at the country level correctly without any use of duplicate columns. Also, total is blank as expected.
Download sample workbook: Cities ISINSCOPE.pbix
If you want to use the sample workbook, you will need to publish it to Power BI service, unless you already have the November 2018 version of Power BI Desktop 🙂