Besides potential performance degradation, which we covered in the previous blog post, you should avoid filtering whole tables in DAX because sometimes you may get unexpected results. In this blog post, I’m showing one example.
First, imagine you’ve got three measures like so:
1 Sales = SUM(Sales[SalesAmount])

2 All Product Balance =
CALCULATE(
    [1 Sales],
    REMOVEFILTERS('Product')
)

3 Single Quantity Balance =
CALCULATE(
    [1 Sales],
    FILTER(
        Sales,
        Sales[Quantity] = 1
    )
)
The three measures, sliced by product color, are shown next:
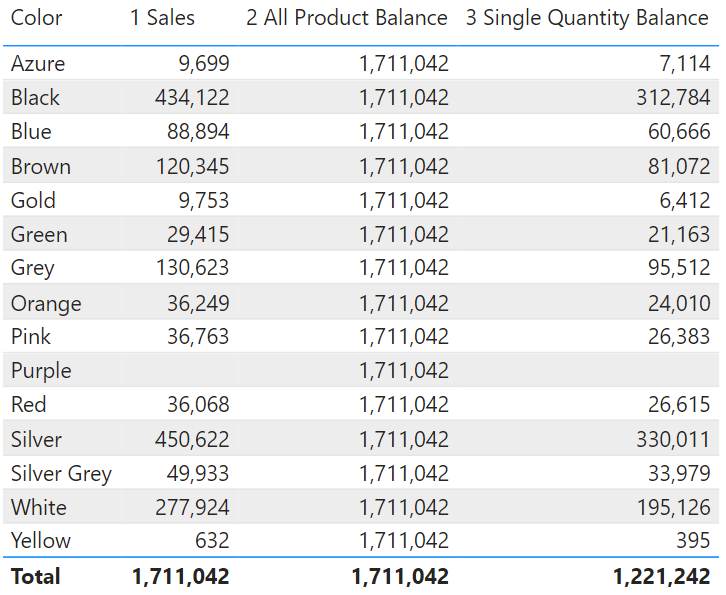
Nothing special so far:
- [1 Sales] is just a SUM
- [2 All Product Balance] shows the total of [1 Sales] for all colors, even those that had no sales, because we’re ignoring any filters on Product
- [3 Single Quantity Balance] shows only those sales where the Quantity is 1, so the figures are lower than those of [1 Sales]
Now let’s look at the following measure:
4 All Product Single Quantity Balance =
CALCULATE(
    [2 All Product Balance],
    FILTER(
        Sales,
        Sales[Quantity] = 1
    )
)
If we slice that measure by product color, what do you expect to see? On the surface, we’re trying to calculate only those sales where Quantity is 1, and we’re also ignoring any filters on the Product table. Since Quantity and Product have (seemingly) nothing to do with each other, you may expect the same number for every color, which should be the same as the grand total of [3 Single Quantity Balance] above. Is this what you expect? Pause and think before continuing reading.
Here are the results:
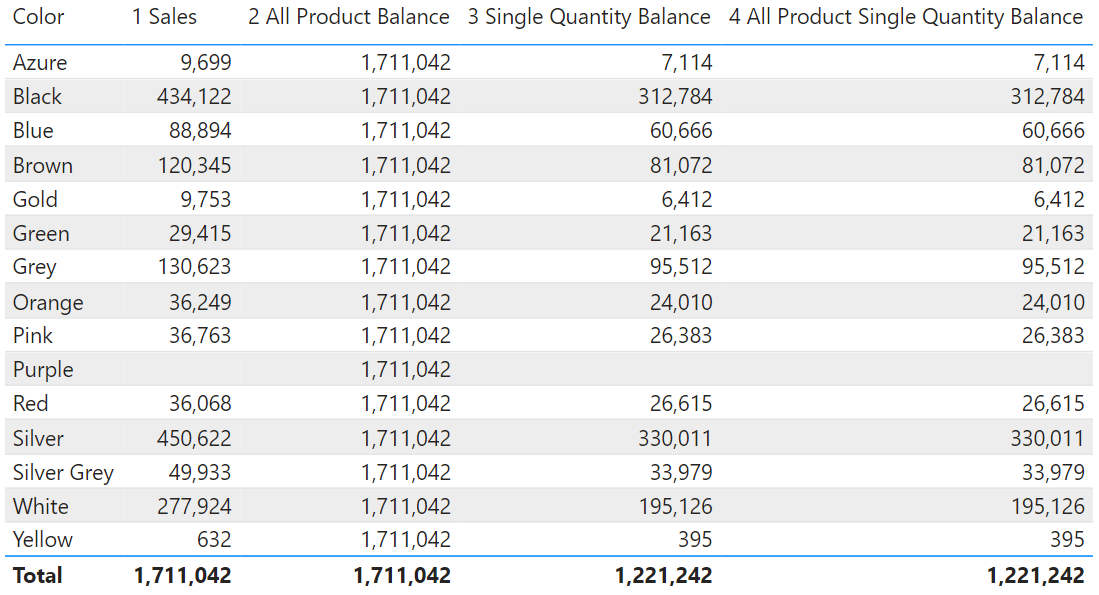
What’s going on? The issue here is expanded tables.
Note: if you’re not familiar with expanded tables, I recommend SQLBI’s article on it: Expanded tables in DAX – SQLBI.
When you filter a whole table in FILTER, it’s actually an expanded table, which includes its related tables — in this case, the expanded version of Sales includes Product. It doesn’t matter that we remove filters from Product inside [2 All Product Balance] because the expanded version of Sales, which respects filters on colors, already filtered [2 All Product Balance]. It’s a complex concept, and if you’re struggling to understand it, just remember that you should filter columns, not tables. To fix the problem, get rid of FILTER like so:
4 All Product Single Quantity Balance fixed =
CALCULATE(
    [2 All Product Balance],
    Sales[Quantity] = 1
)
Now the results make more sense:
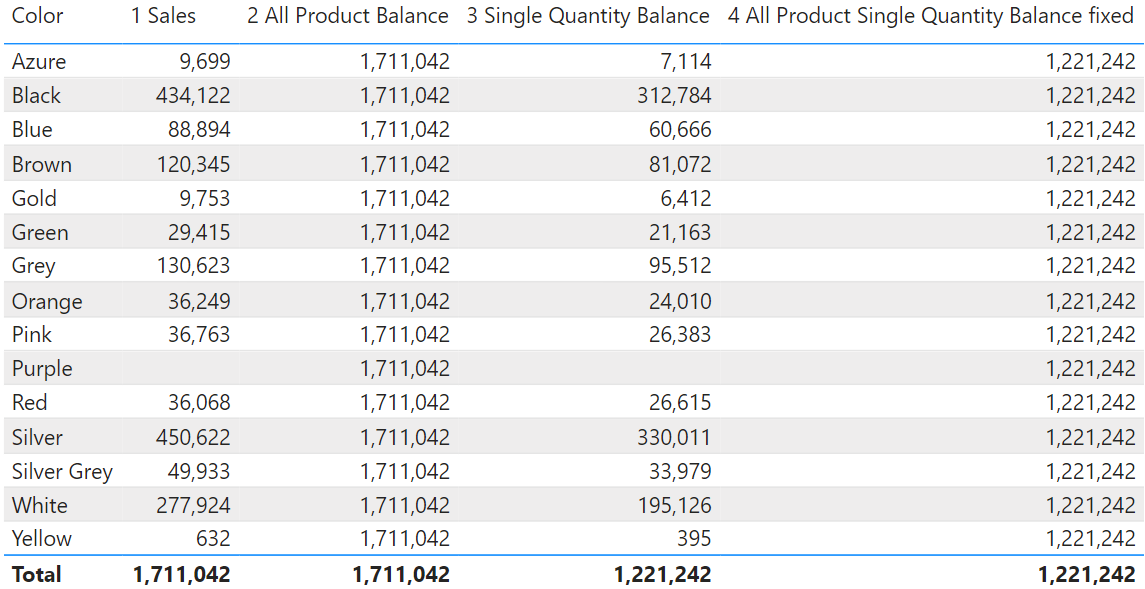
Happy filtering!