How many ways there are to create a Year-Month column in DAX? In this blog post, I’ll show you one bad way, one OK way, one good, and one great way.
Bad
Let’s say we want a columns with year and month in the YYYYMM format, like 202203 for March 2022, for example. Have a look at the following formula:
Example bad =
YEAR('Date'[Date])
& IF(
    MONTH('Date'[Date]) < 10,
    CONCATENATE(0, MONTH('Date'[Date])),
    MONTH('Date'[Date])
)
The formula does the job; that being said, there are several issues here:
- The result is text, which might not be what you want (an integer)
- The IF logic makes the formula unnecessarily complex
- Why use & in one place and CONCATENATE in another?
- Why calculate MONTH so many times?
OK
The biggest issue is that the bad formula is way too long for what it needs to do. There are six function calls, while you could get the same result with just one:
Example OK =
FORMAT(
    'Date'[Date],
    "yyyymm"
)
Good
The result of the OK formula is still text, and there are three ways to solve it:
- Change the data type to Whole number manually
- Convert the data type explicitly by using INT, VALUE, or CONVERT
- Use a different formula
I don’t find the first two ways particularly exciting, so here’s a pretty standard way to get YYYYMM values from a date, often found in data warehouses:
Example good =
YEAR('Date'[Date]) * 100 + MONTH('Date'[Date])
Note: what if you needed a full date as an integer? You guessed it right: you’d multiply year by 10000 and month by 100 before adding them and days together.
Now the result is an integer, so you can even use a continuous axis, except it’s going to look a bit ridiculous. The following line chart shows the number of days by the year-month column we created:
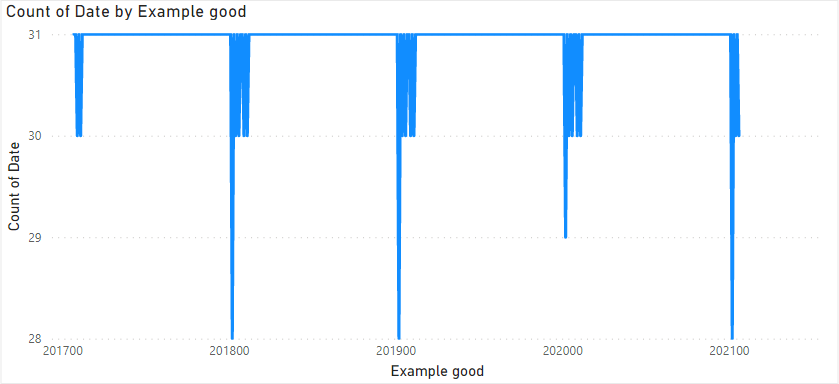
Converting the axis to categorical just makes the visual scrollable.
Great
So what can we do? We can use the following formula:
Example great-ish =
EOMONTH('Date'[Date], 0)
The great thing about this formula is that the result is of type Date, and we can apply a custom format string to it to make it easily readable to a human being without worrying about sorting as is the case with human-readable text columns. If you’re adamant about having YYYYMM columns, you can apply that as a custom format string too.
Why did I call it “great-ish”? Because there’s a small problem. Look at the tooltip and the axis label:
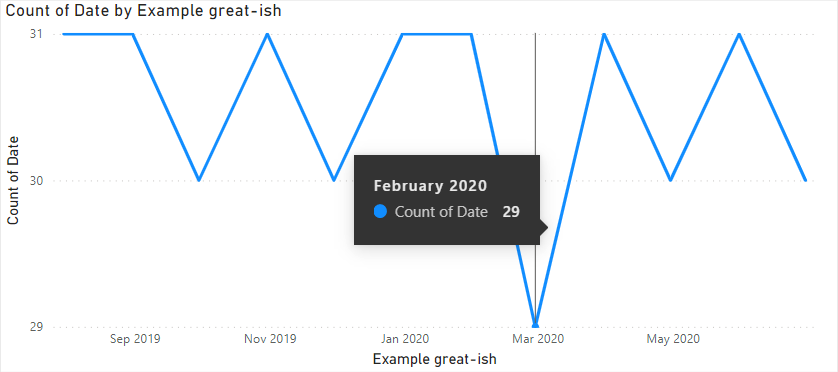
Why does the tooltip say “February 2020”, while the axis clearly says “Mar 2020”? That’s because our column values are end of month dates, while the axis labels are placed at month start dates. Since 29 February 2020 is just a day before 1 March 2020, we’re getting this issue. Can we do anything about it? Yes — just calculate the start of the month instead:
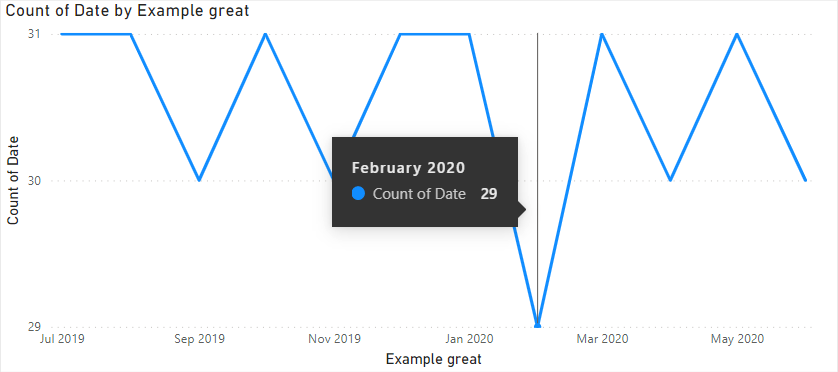
Example great =
EOMONTH('Date'[Date], -1) + 1
And that’s it — the issue is now gone!
Power Query?
If I had a choice, I’d likely use Power Query here, which would allow you to create a year-month column by using the user interface alone — the storage might be more efficient too!
Download the sample file: 4 Year Month.pbix