Do you know what CALCULATE with just one argument does? In a measure? In a calculated column? This is the topic of this blog post.
In a measure
Let’s say you want to write a measure that returns the last date from a column, irrespective of any filters a user may apply. This is a solution I saw once:
Example bad = CALCULATE(MAX(Sales[OrderDateKey]))This formula is bad because it doesn’t do what it’s supposed to do: any filter that affects the Sales table will affect its result. Here’s a better solution:
Example good =
CALCULATE(
    MAX(Sales[OrderDateKey]),
    REMOVEFILTERS()
)
REMOVEFILTERS, when used with no arguments, will remove all filters. So even you write this measure, then add a new table to your model, this formula will still ignore filters from the new table.
There’s another reason why the bad formula is bad: it’s a measure that uses CALCULATE with only one argument to return its result, which is completely pointless, and it happens fairly often. You could remove CALCULATE and still get the same result.
When I ask someone why a measure formula has CALCULATE with just one argument, I rarely get a satisfying response. One reason could be “there were filters that were removed, and CALCULATE stayed”. Sometimes you hear that a measure won’t work without CALCLATE (not true).
Is CALCULATE with one argument ever warranted? Yes, when you’re performing context transition. You can perform context transition within a measure of course, although it’s much easier to illustrate by using a calculated column.
In a calculated column
Let’s start with the following table called Table:
| Letter | Number |
| A | 1 |
| B | 2 |
| C | 3 |
Now let’s add the following calculated column:
Sum Number = SUM('Table'[Number])The result will be as follows:
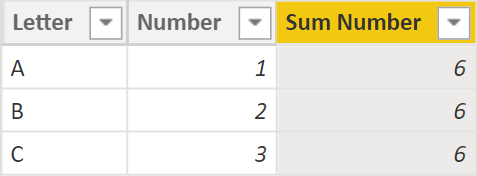
SUM uses the filter context, and there are no filters in a calculated column by default, so we’re performing the operation over the entire table, hence the same result in each row.
Now let’s add the this calculated column:
Calculate Sum Number = CALCULATE(SUM('Table'[Number]))
This time the result is different:
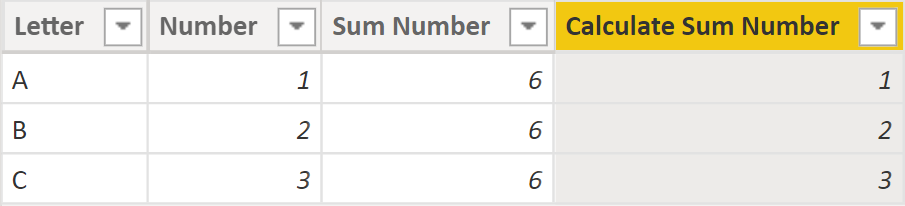
Now CALCULATE transforms the row context into filter context, so the values from each column become filters. In the first row, DAX is calculating the sum of the Number column where the following conditions are true:
- Letter = A
- Number = 1
- Sum Number = 6
Since there’s only one row that fits this criteria, the result is 1. And so on.
And now let’s leave the calculated columns as is and modify the Table table as follows (note the last row):
| Letter | Number |
| A | 1 |
| B | 2 |
| B | 2 |
Let’s have a look at the loaded table:

Since we changed the numbers, the Sum Number column now shows 5 for every row — no surprises here. But why do we see 1, 4, and 4 in the last column? Again let’s mentally perform context transition. In the first row, DAX calculates the sum of the Number column where
- Letter = A
- Number = 1
- Sum Number = 5
In the second row, the conditions are
- Letter = B
- Number = 2
- Sum Number = 5
Since there are two rows that match these conditions, the result is 2 + 2 = 4, and the same thing is happening in the third row.
That’s exactly why having duplicate rows in your facts, even if they’re legitimate duplicates, can be dangerous — sometimes you may get unexpected results. Be careful with your facts! And don’t leave CALCULATE with no filters in your measures unless you’re performing context transition.
Download the sample file: 5 CALCULATE.pbix