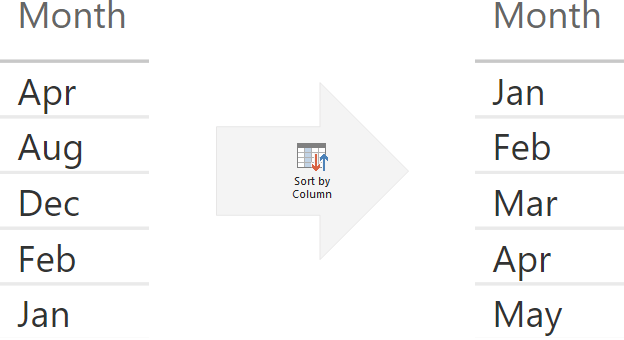
The Sort by Column feature of Power BI and tabular data models in general is well-known. The simplest example is sorting month names by their actual position in a year instead of the default (alphabetic) order. There is a popular misconception that there must be a one-to-one mapping between the column you are sorting and the column you are sorting by. This is not so, and in this blog post I am discussing unusual applications of the Sort by Column feature.
Sort by Column requirements
There are two requirements for sorting column A by column B:
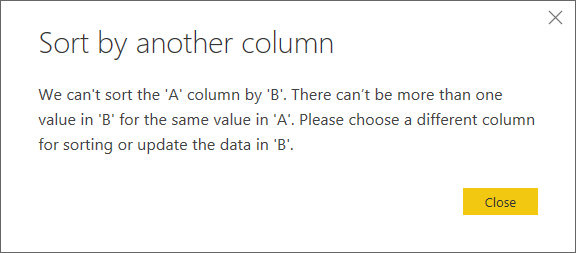
- For each value in column A, there must be exactly one value in column B.
If this is violated, you will see the following error message:
- Column B must not be a calculated column that references column A.
Otherwise, you will get this error message:

At the same time, note that the following statements are true:
- For each value in Column B, there can be more than one value in Column A.
- Column A can be a calculated column that references Column B.
Use case 1: sorting by fewer values
Recently I’ve been working with data from Australian Bureau of Statistics (ABS), who publish their data in HTML tables on web pages. The tables are grouped into catalogs, and the tables are often named inconsistently — here are some examples:
- TABLE 06. Activity, Australia, Original
- Table 1. Key National Accounts Aggregates
- TABLE 11A. Average Weekly Earnings, New South Wales (Dollars) – Trend
- TABLE 11a. SERVICES CREDITS, Original, Current prices – Quarterly
- TABLE 11B. Average Weekly Earnings, Victoria (Dollars) – Trend
- TABLE 11b. SERVICES DEBITS, Original, Current prices – Quarterly
- TABLES 1 and 2. CPI: All Groups, Index Numbers and Percentage Changes
Note how the default (alphabetic) order puts ‘Table 06’ before ‘Table 1’, and there are several ‘Table 11’s, which come from different catalogs, as well as multiple ‘Table 11’s from the same catalog. The users complained because to them the order did not make any sense.
At first sight, it looked like a nightmare: I thought I had to create a sorting number for every single table name — almost manually, because the table names were so inconsistent. In total, there were over 700 different tables, with actual table numbers ranging from 1 to 91, so this would have taken quite some time.
Then I realized I can sort all tables with the same number by that number, because they appeared in different catalogs anyway. These tables would never be seen together, so their order relative to each other did not matter.
Incidentally, this also solved the problem of sorting tables with the same number but different suffixes, such as Table 11A and Table 11B. If I sorted them both by number 11, then they would be sorted alphabetically among themselves — exactly what was needed.
The only problem left to solve was extracting the table number. Luckily, we have the Text.Select M function, which can extract a predefined list of characters from a string. I just had to use the following formula:
=Number.From (
    Text.Select (
        [Full table name],
        List.Transform ( {0..9}, Text.From )
    )
)
Here is what the formula did:
- First, it generated a list of numbers from 0 to 9 (the yellow bit)
- Second, each number was transformed into text. Text.Select works with text only, and Power Query is a strongly typed language, so we need to perform the type conversion explicitly (the red bit)
- Third, all characters in table names were removed except for numbers (the blue bit)
- Finally, the formula converted the numeric text characters back to numbers, otherwise they would not appear in the right order (the green bit)
Note: for educational purposes, the formula above is longer than it needs to be. You can achieve the same result with the following formula:
=Number.From (
    Text.Select (
        [Full table name],
        {"0".."9"}
    )
)
After this, I could sort the table name by the table number, even though the latter contained far fewer values than the former.
Use case 2: sorting calculated columns
If you ever used grouping and binning in Power BI Desktop, you would know that the feature does not automatically create sorting columns, and you may still need to sort the grouped values. Consider the following simplistic example:
- We have a numeric column called Age, with values ranging from 0 to 120. If you want to follow the examples below, you can create the following calculated table:
Age = SELECTCOLUMNS ( GENERATESERIES ( 0, 120 ), "Age", [Value] ) - We want to group age values into three categories:
- Minor (0-17)
- Adult (18-67)
- Senior (all other)
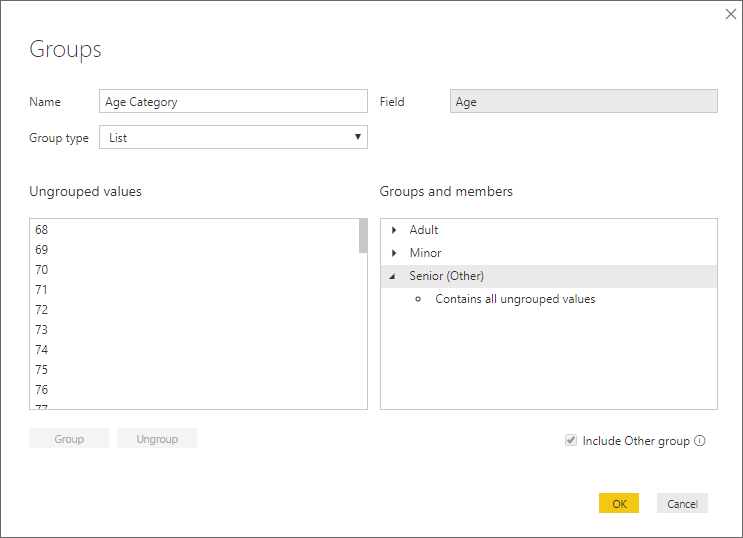
Note: you don’t have to click through every value to make selections — you can press and hold the Shift key to select a range of values.
The problem is that the alphabetic order of the categories does not correspond to their age order:
- Adult
- Minor
- Senior
We can try a few ways of solving the problem without opening Power Query Editor: we can create another group, or a calculated column.
Secondary group
To create a sorting column, we can create another group — only this time use values 1, 2 and 3 as group names:
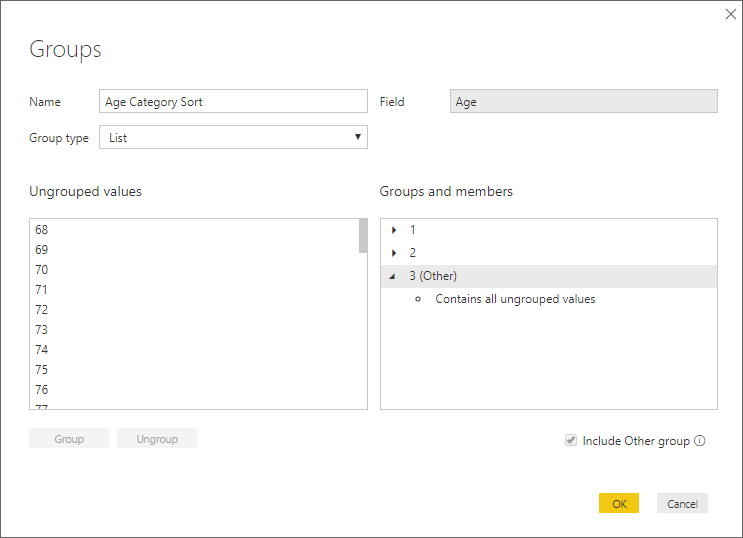
Then we can sort Age Category by Age Category Sort. This method works, although it has two drawbacks:
- We need to select the same values again, which can be time-consuming and error-prone.
- We need to be very careful to keep the two groups synchronized — if we decide that age 68 should now fall into the Adult category instead of Senior, then we should adjust both groups.
Also, if you have double-digit groups, make sure to set the data type of the new column to numeric, because by default it will be text and 10 will come before 2, for example.
Calculated column
Alternatively, we can create a calculated column with the following formula:
Age Category Sort CC =
SWITCH (
    Age[Age Category],
    "Minor", 1,
    "Adult", 2,
    3
)
This method addresses the shortcomings of the previous method:
- We no longer need to pick all the values again
- As long as the number of groups is the same, we don’t need to worry about keeping the two columns in sync
Unfortunately, we will not be able to sort Age Category by Age Category Sort CC — we will see the following error message:
To address this problem, we can create a grouping column Age Category Sort Group and name our groups 1, 2 and 3 (remember to change the data type to numeric if you have double-digit numbers), then create the following calculated column:
Age Category CC =
SWITCH (
    Age[Age Category Sort Group],
    1, "Minor",
    2, "Adult",
    "Senior"
)
We can now sort Age Category CC by Age Category Sort Group.
Other considerations
Even seasoned consultants still get surprised by the fact that sorting columns become part of filter context whenever you use the column you are sorting. For example, if you want to remove filters from month names, you also need to do it for month numbers. You can read more about this behavior in an article by Matt Allington: “The ALL() Function in DAX“.