Soon, 49 financial DAX functions are coming to Power BI. All the functions are available in Excel already. See the full list below. Continue reading “New DAX functions (June 2020)”
Category: Power BI
Understanding model recalculation in Power BI
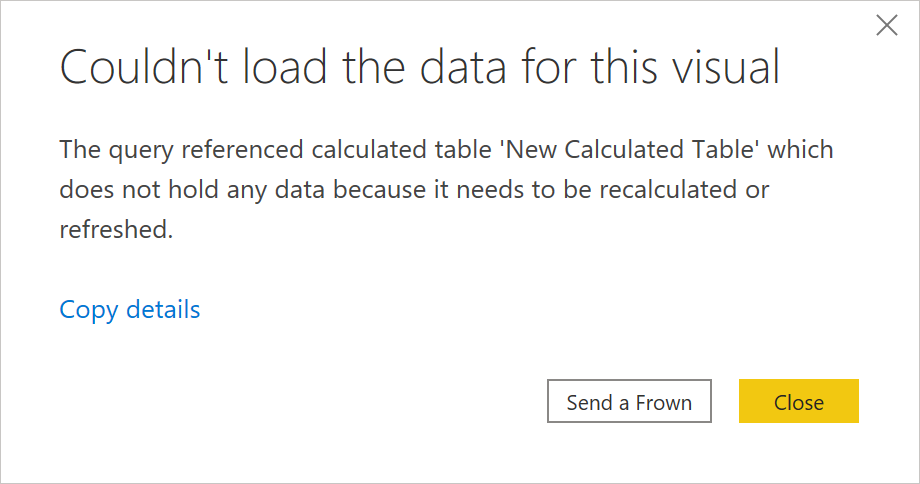
Have you ever wondered why in Power BI calculated columns and calculated tables are called calculated and measures are not? That’s because in a certain sense, measures aren’t calculated, and calling them “calculated measures” is wrong. In this blog post, I’m discussing the implications of it–what recalculation in Power BI is, and how you can perform it. Continue reading “Understanding model recalculation in Power BI”
Dynamic page navigation and drillthrough
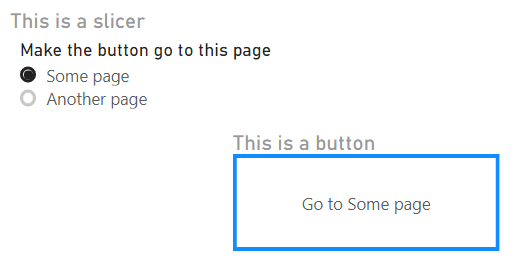
Starting in May 2020, Power BI allows you to navigate or drill through to pages by using conditional formatting. In this blog post, I’m showing how to make it work. Continue reading “Dynamic page navigation and drillthrough”
Using text measures in multi-row cards in Power BI
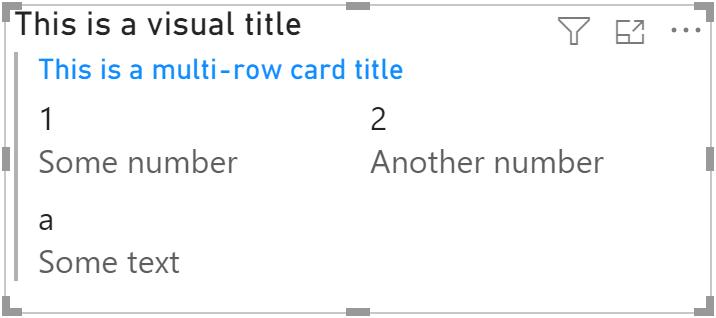
A not-so-well-known feature of the multi-row card visual in Power BI is that it can have its own title, called Card Title, in addition to the title any visual can have. In the image above, the Card Title is blue, and it is formatted separately from the visual title. It only works if you use one measure that returns text, and all other visuals are not text. In this blog post, I’m sharing a technique to display text as values in a multi-row card and still have the special Card Title. Continue reading “Using text measures in multi-row cards in Power BI”
Sort by Column in Power BI
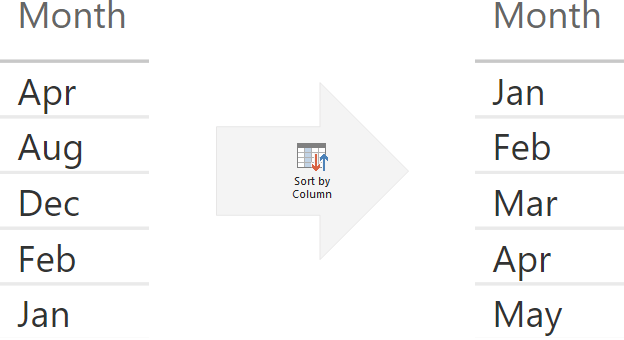
The Sort by Column feature of Power BI and tabular data models in general is well-known. The simplest example is sorting month names by their actual position in a year instead of the default (alphabetic) order. There is a popular misconception that there must be a one-to-one mapping between the column you are sorting and the column you are sorting by. This is not so, and in this blog post I am discussing unusual applications of the Sort by Column feature. Continue reading “Sort by Column in Power BI”
Exporting all data from a Power BI data model
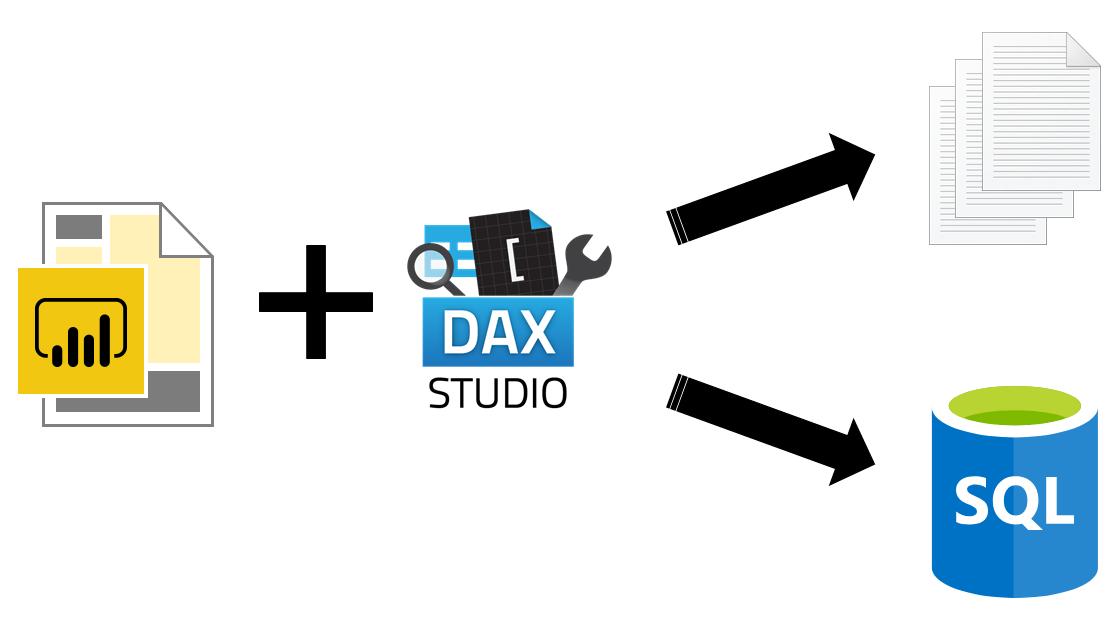
The latest version of DAX Studio, 2.8.0, was released yesterday. It has several new features, one of which stands out for me: Export All Data. While you could write your queries to CSV files or Excel before, this feature allows you to export the whole data model at once to CSV files or — and this is why I really like it — SQL Server. In this blog post, I am showing how to do it. Continue reading “Exporting all data from a Power BI data model”
Power BI dataflows considerations

Recently I’ve been migrating quite a few M queries from .pbix files to dataflows. In this blog post, I’m sharing a few things I learned in the process. Continue reading “Power BI dataflows considerations”
Power Query Advanced Editor keyboard shortcuts
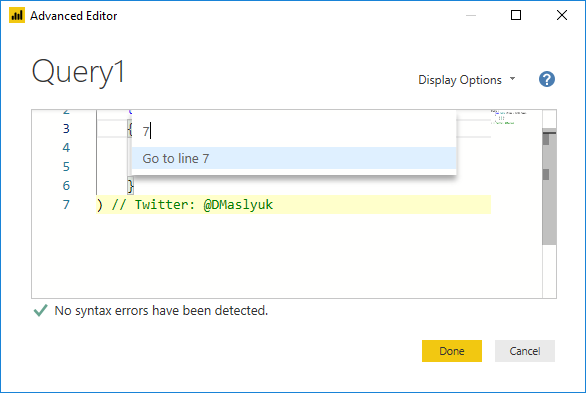
Remember my post about DAX formula bar keyboard shortcuts in Power BI Desktop? Turns out, there are also lots of keyboard shortcuts in Advanced Editor inside Power Query Editor in Power BI, with many being the same as in DAX formula bar! Continue reading “Power Query Advanced Editor keyboard shortcuts”
Checking facts and creating better graphs with Power BI
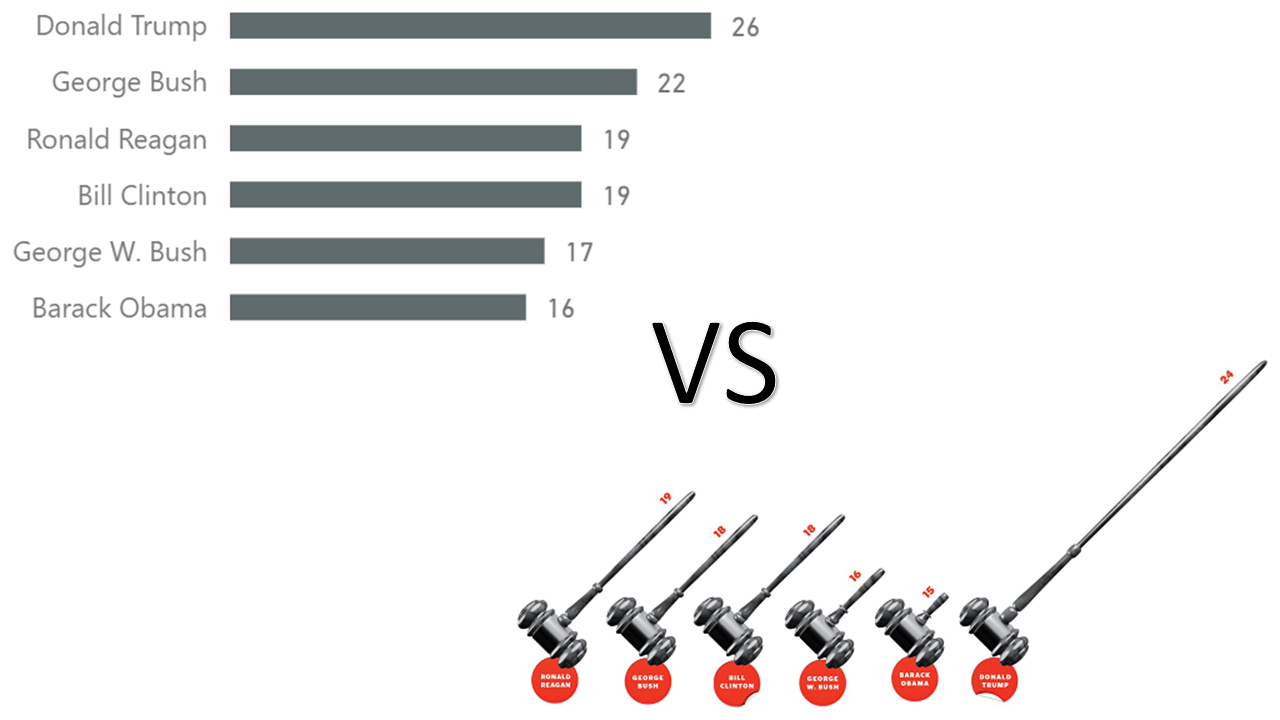
I am currently taking a data visualization course, and one of the first assignments was to find a bad graph and fix it. To do so, I needed to find the original data and reproduce the graph by applying data visualization best practices. I used Power BI to help me with the task, and I thought I’d share the results. Continue reading “Checking facts and creating better graphs with Power BI”
Choosing font color based on background color in Power BI
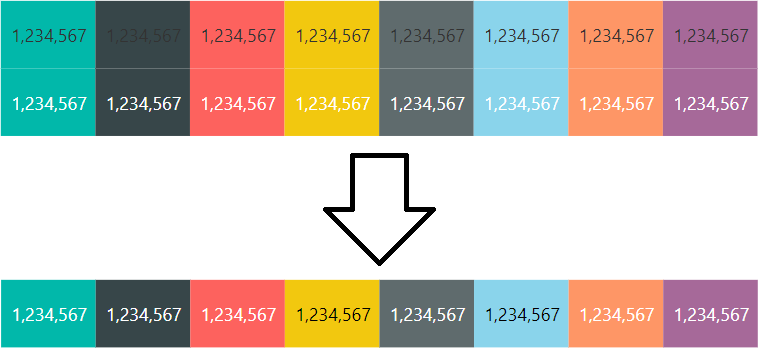
In August 2018, the Power BI team has released a new feature: conditional formatting by field value. This feature works for both background colors and font colors. Because different background colors require different font colors for text to be legible, it makes sense to use both at the same time. In this blog post, I am showing how you can dynamically choose the font color depending on the background color. Continue reading “Choosing font color based on background color in Power BI”