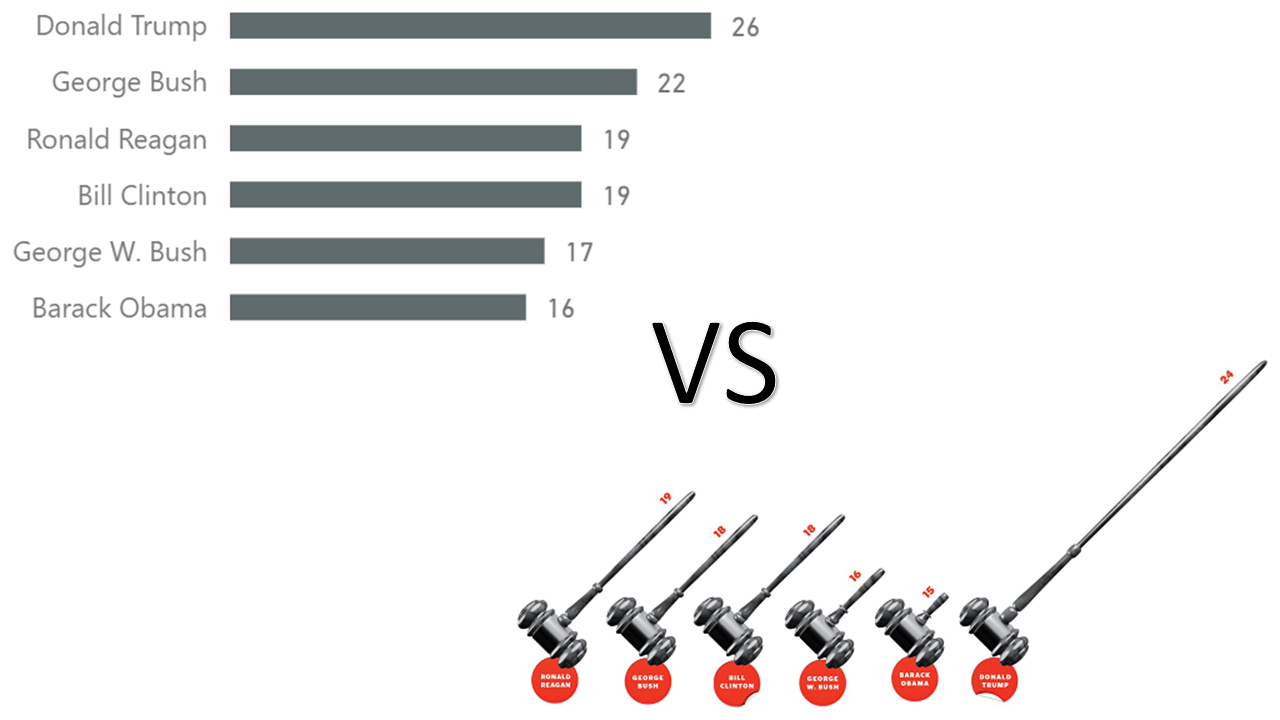
Choosing font color based on background color in Power BI

In August 2018, the Power BI team has released a new feature: conditional formatting by field value. This feature works for both background colors and font colors. Because different background colors require different font colors for text to be legible,  it makes sense to use both at the same time. In this blog post, I am showing how you can dynamically choose the font color depending on the background color. Continue reading “Choosing font color based on background color in Power BI”

Conditional formatting by field value in Power BI

In August 2018, a new type of conditional formatting has been added to Power BI: by field value. In this blog post I’m explaining how it works.

This feature is already available in Power BI service and is coming to Power BI Desktop in the next release. Continue reading “Conditional formatting by field value in Power BI”

Changing outer background of Power BI reports

When you publish a Power BI report to web, its outer background color will be grey by default. This may be undesirable if your report does not fit the screen perfectly, which will likely happen, because not all screens are of the same size and ratio. This blog post shows how you can change the outer background color. Continue reading “Changing outer background of Power BI reports”

DAX formula bar keyboard shortcuts in Power BI Desktop

There are several undocumented DAX formula bar keyboard shortcuts in Power BI Desktop. For instance, you can comment or uncomment portions of your code, go to a specific line of code, and do other things. Some of the keyboard shortcuts are more useful than others — this blog post lists all that I am aware of. Continue reading “DAX formula bar keyboard shortcuts in Power BI Desktop”

Switching from imported data to DirectQuery or Live Connection in Power BI

You can switch from Import to DirectQuery or Live Connection, and from DirectQuery to Live Connection

In some cases, it may be necessary to separate a Power BI report from its dataset. For example, you may want to have multiple reports based on a single dataset, or you may have upgraded to Analysis Services. Currently, Power BI Desktop does not provide a simple way of switching from imported data to Live Connection or DirectQuery, but there are some workarounds. Continue reading “Switching from imported data to DirectQuery or Live Connection in Power BI”

Combo charts with no lines in Power BI

At the moment, Power BI has two visuals that support two Y axes: the line and stacked column chart, and the line and clustered column chart. In the May 2018 release of Power BI Desktop, there is going to be an important enhancement to these charts (as well as the various line visuals): we will be able to set the line stroke width to zero (this can already be done in Power BI service). In this blog post, I am going to show two use cases for it. Continue reading “Combo charts with no lines in Power BI”